
Trapped Data in Reports? 7 Smart Ways to Pull Tables Into Excel.
To extract tables from reports into Excel, match the method to the file type. Use Excel's built-in PDF import feature for clean digital reports. Use OCR for scanned documents and photos. Use automation tools for repetitive tasks. Finally, verify the totals before relying on the figures. Below are seven ways to do this, along with simple tips for cleaning spreadsheet data. First, Know What Kind of Report You Have The file type determines the best method. A digital PDF contains actual text, whereas a scanned report is merely an image. Some reports exist as web pages, emails, or Word documents. Here is a quick test: try highlighting the text with your mouse. If it works, the file is digital. If it doesn't, you need OCR. OCR is software that reads characters within images. Additionally, not all tables have visible borders. Some tables consist simply of text arranged in columns, and tools might overlook them.
Recommended to Read:Sign Contracts From Anywhere: A Remote-Ready Paperwork Playbook
Smart Ways to Extract Tables into Excel
Way 1: Look for a Built-In Export Button
Start here. Many reporting tools let you download a table straight to Excel. Some even export every table at once, with each table on its own tab. In some tools, the report owner must switch this option on first.
This route gives you the real numbers, not a conversion guess. Check the report menu before you try anything else.
Way 2: Copy and Paste Small Tables
For a short, simple table, copy and paste works fine. Open the report, select the table, press Ctrl+C, and paste it into Excel.
It has limits, though:
- Copy-protected files block it.
- Unusual fonts can break the text in Excel.
- With many tables, you can paste the same one twice or skip one.
Use this method for quick jobs only.
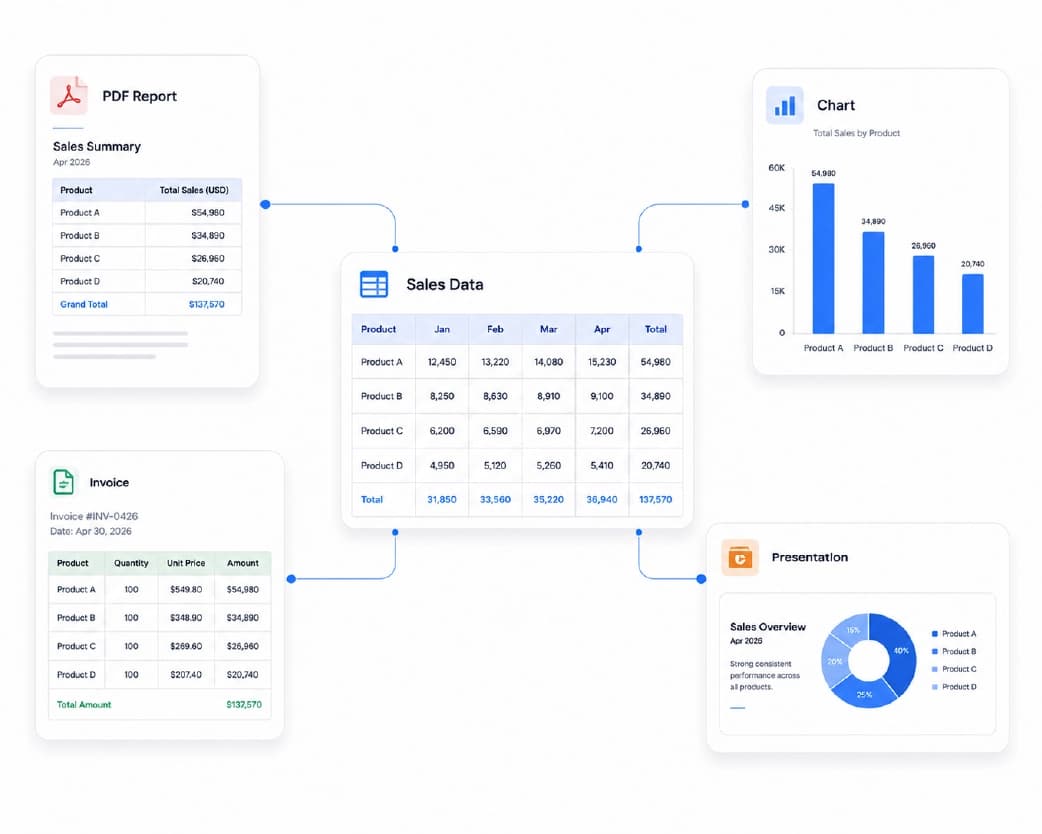
Way 3: Use Excel's Get Data From PDF Tool
Excel can read tables from a digital PDF by itself. Follow these steps:
- Open a blank workbook and go to the Data tab.
- Click Get Data, then From File, then From PDF.
- Pick your file. A Navigator window shows each table it found.
- Click a table to preview it.
- Choose Transform Data if you want to fix headers or data types. Otherwise, choose Load.
- Click Close & Load to place the table in your sheet.
If you do not see this option, your version of Excel may not include it.
Way 4: Snip Long Tables Across Many Pages
Some reports repeat the same table layout on every page. Certain Excel add-ins let you draw a box around the table once. Then you copy that box position to other pages. This saves a lot of clicking in long reports.
You can also add or remove rows and columns in the preview before the data lands in your sheet.

Way 5: Use OCR for Scanned Reports and Photos
If your report is a picture, Excel can still help. Go to the Data tab and choose From Picture. Then pick a file or paste from your clipboard.
Excel shows the text it reads in a side panel. It highlights unsure cells in light red. Click each one and fix the value. Then click Insert Data.
Clean, printed tables work best. Handwriting is much weaker, and you will fix many cells by hand.
Way 6: Try a Browser-Based Extractor
You do not always need to install software. A browser tool such as Plainscan can convert PDFs to Excel, run OCR on scanned files, and pull table data. It has a free version and needs no account. Its listing says it deletes files automatically after 24 hours.
Tools like this suit one-off jobs and people who work on different devices. Still, always read the privacy terms before you upload private reports.

Way 7: Use Data Entry Automation for Repeat Reports
Do you pull the same table every week? Stop doing it by hand. Data entry automation saves time and cuts typing errors.
Many teams use Excel macros. Macros need coding skills, though. They can also break when many people edit the same file, and they can bring security risks. No-code automation tools are a simpler option. They read the data from its source and write it into Excel for you.
Spreadsheet Data Cleaning: Check Before You Trust the Numbers
Getting the table into Excel is only half the job. Imported data often has small flaws. Use this checklist:
- Keep the original file. Work on a copy.
- Turn your range into an Excel Table with Ctrl+T. Sorting and filtering get much easier.
- Remove merged cells and unhide hidden rows.
- Check negative numbers. Signs can flip during import.
- Compare the row count with the original report.
For financial report analysis, add one more step: test the totals. On a balance sheet, assets must equal liabilities plus equity. If they do not, something moved or went missing during import. Also write down where the data came from and when you pulled it.
Common Mistakes to Avoid
- Using screenshots of tables. They give poor results. Use the original file when you can.
- Skipping OCR on a scanned file. Without OCR, Excel gets a picture, not data.
- Sending private files to strangers for typing. A payroll report, for example, should never leave your control.
- Trusting the first result. Always check a few rows against the source.
Sometimes a tool says it found no tables. The report may use loose text instead of a real table. In that case, extract the plain text first. Then split it into columns in Excel.
Frequently Asked Questions
1. Can I extract tables from reports for free?
Yes. Copy and paste costs nothing, and Excel's Get Data tool is built in. Some browser tools also offer free versions. Plainscan, for example, lists a free version. Free options work best for small jobs or clean files.
2. Why does my table paste into one column?
A PDF stores text by position, not in cells. Excel sees one long block of text. Use Get Data From PDF instead, so Excel can detect the table. If you only have loose text, split it into columns afterward.
3. How do I handle tables in scanned reports?
Use OCR. Excel's From Picture tool or a browser OCR tool can read the table. Then review every cell Excel marks as unsure. Scanned and handwritten files need the most checking.
4. How can I tell if my imported data is correct?
Compare the row count with the original report. Then test the totals. On a balance sheet, assets should equal liabilities plus equity. Also scan for flipped negative signs.
5. Is it safe to upload financial reports to online tools?
Check the privacy terms first. Look for how long the tool keeps your files and who can see them. For sensitive reports, follow your company's data rules before you upload anything.
6. When should I move from manual work to automation?
Move when you repeat the same task often or handle many files. If you spend hours each week on the same table, data entry automation will likely pay off.
Conclusion
You can extract tables from reports in many ways. Pick the simplest one that fits your file. Export buttons and copy-paste handle easy cases. Excel's PDF import, OCR, and snipping tools handle harder ones. Automation takes care of repeat work. Whatever you choose, clean the data and check the totals. That is how reporting data to a spreadsheet becomes numbers you can rely on.
Related insights




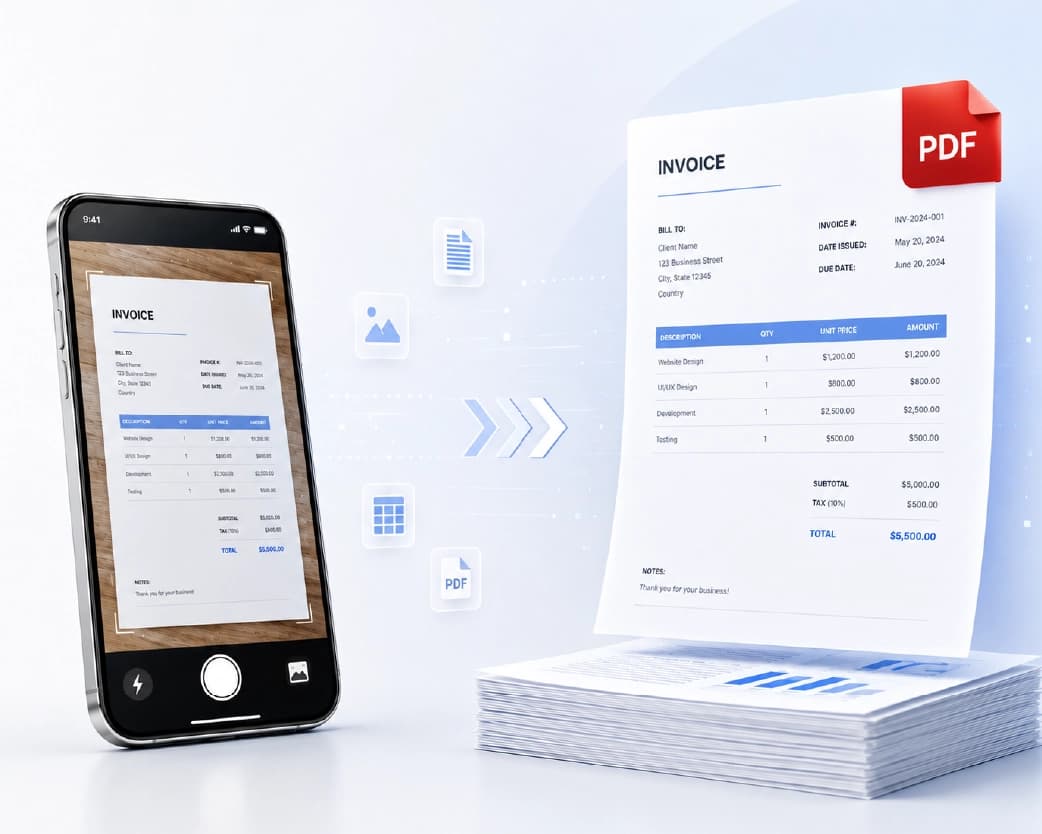



Get the Plainscan App for iOS & Android